
In this case study, we are to evaluate the feasibility of a marketing agency’s offer to a telecommunications company. The promotion would be distributing free SIM cards to households (that already has 40 pesos worth of prepaid load) to increase the subscriber base. If those SIM cards were to be activated, and the users buy load for it, it will be source of future revenue.
Here is how the promotion program is supposed to run:
- The distribution team would be composed of a driver, and 10 distribution agents
- The team will visit 1 barangay per day, for 100 days.
- The team will work from 8AM-5PM.
- Their work day will start and end on the company HQ in BGC (Fort Bonifacio, Taguig City).
Our goal is to use demographic data from the Statistics Office to determine which barangays to visit, and the financial feasibility of the project.
Exploring the Data Set
The dataset lists all barangays in the Philippines and has columns for the geographical hierarchy such as “Major Island”, “Region”, “Province”, and “City/Municipality”. More importantly, it has data on the “Population”, “Number of Households”, “Area”, and “Coordinates” (longitude and latitude).
To get the barangays that will give us the most number of distributed SIM cards, there are three criteria that we need to lookout for:
- Proximity to HQ – the drive time (both ways) is included on the work day. Going to barangays that are relatively nearer is better.
- Number of households – assuming no time constraints, this is the maximum number of SIM cards that we can distribute.
- Household density – since our team will be on foot, houses packed closely together reduces time wasted on walking between households.


We are given the coordinate location of each barangay. We can compute the direct distance between each barangay and Fort Bonifacio, then use the average vehicle speeds, to compute for the travel times. That felt finnicky. Fortunately, I learned that I can access Google Maps API (free, but limited use) to get road distance and estimated travel times directly. Since I can only use the API for a limited number of calls, I decided to only compute for barangays in NCR and neighboring Region IV.


The population in the Philippines is heavily concentrated on the National Capital Region, and some neighboring cities, in Region IV. The graph above show that the city with the highest median number of households in a barangay is actualy Dasmarinas in Cavite. But of course, the definition of a barangay is not uniform. In some places, a big suburban development is just one barangay, while in the densest parts of the city, a few collection of streets is a barangay.
Computing the number of SIM cards that we can distribute
The marketing agency provides us with the following estimates:
- 90% of households answer door-to-door agents
- 75% of those who answer will accept the freebie
Additionally they also provided us with estimated times for each kind of interaction


Using probability, we are able to compute for the theoretical maximum number of SIM cards that we can distribute (with no time constraints) and compute the average interaction time.

To factor in the household density, we must be able to convert it to distance since we were given an estimate for the average walking speed of our agents. I used the square root function as area is the square of distance. It feels kind of hand-wavy but the walking time that I got was pretty sensible.


By combining the interaction time and walking time, we can compute the amount of SIM cards that our team can distribute for an hour. Then by multiplying that with the remaining time, we were able to compute the amount of SIM cards distributed for the whole day. Finally, if the computed value exceeds the theoretical max, we substitute the theoretical max into the column. With this we have incorporated our three criteria.

By selecting the top 100 barangay in terms of SIM cards distributed, we are able to compute the total number of SIM cards, and show the breakdown per city.
Feasibility Study

The agency gave us an estimate that only 25% of the distributed SIM cards will be activated and become a source of future revenue. We also know the expense and expected revenue for each SIM card. The agency requests a 3 Million peso budget for the execution of this promo. That must also be included as an expense.

The project will will net us a small profit of 2.25M for the first year. However, we must check how sensitive this value is to the changes of the agency’s estimate.


The profit is not that sensitive to changes in the acceptance rate (percent of households that accept the freebie) but is very sensitive to the conversion rate (SIM cards activated). It will be a net loss if only 20% of SIM cards are activated.
Conclusion and Suggestions
The strategy has promise, but we need to increase the acceptance rate. There are barangays with small land areas but high populations that are within walking distance of each other in Metro Manila. If we cluster them as and count them as just 1 barangay, we might be able to hand out more SIM cards. Age and income demographics were not included in this study. Targeting a demographic group that more likely to activate the SIM cards might increase our profit.
Other Articles
Build an Automated ETL Pipeline. From setting up Docker to utilizing APIs and automating workflows with GitHub Actions, this post goes through it all.
Mastering Pipelines: Integrating Feature Engineering into Your Predictive Models
Master predictive modeling with Scikit-Learn pipelines. Learn the importance of feature engineering and how to prevent data leakage.
Unlocking Data Science: Your Easy Docker Setup Guide
Ready to dive into data science? Learn how to set up your development environment using Docker for a seamless and reproducible workspace. Say goodbye to compatibility issues and hello to data science success!
In this short project, I scraped all of Lebron's regular season points and plotted them in an interactive graph.
Predicting a Fitness Center’s Class Attendance with Machine Learning
In this project I analyzed a fitness center's attendance data to predict attendance rates of its group classes.
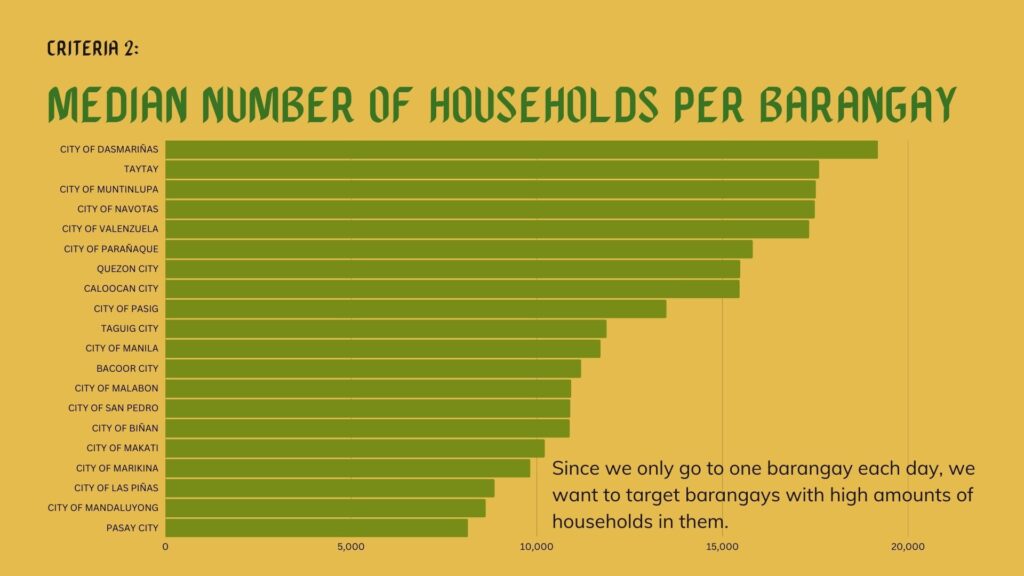
The tweet that started the trend was posted on June 12 (Philippine Independence day). On that tweet, the author stated that he dined in at a Tropical Hut branch, and he is their only customer. Despite the pandemic “restrictions”, commercial activity on malls and fast food chains are pretty much back to “normal”, so having only one customer is disheartening.
In this project I trained a transformer model to recognize words from audio.
In this article, I fine-tuned a pre-trained object detection model using a small custom dataset.
Fast and Free Deep Learning Demo with Gradio
In this article, we will build a simple deep learning based demo application that can be accessed publicly in Hugging Face spaces
The rate at which unreliable news was spread online in the recent years was unprecedented. In this project, I finetuned some language models to make an unreliable news classifier.
In this article, we will discuss how to quickly showcase your model publicly as a machine learning application for free.
In this article, I will discuss a way of accessing Google Cloud GPUs to train your Deep Learning projects.